Image Details
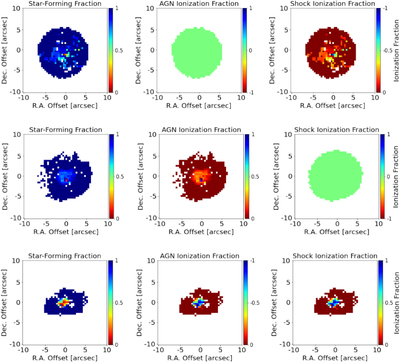
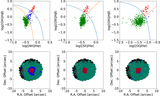
Caption: Figure 12.
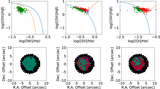
Examples of ionization maps for GAMA 106717, 376478, and 9388000338 (left to right). The relative contribution of each driving power source is shown as a fraction of the total amount of ionization. For galaxies with either AGN- or shock-driven ionization, the corresponding layers are mapped according to the mixing sequence identified by our method. As our method cannot separate ionization sources within a single galaxy, one layer will have no contribution to the total ionization. For galaxies where non-star-forming ionization is detected but we cannot definitively determine between shocks, AGNs, and beam-smearing, a map of negative values is placed in both layers to denote this uncertainty.
Other Images in This Article
Show More
Copyright and Terms & Conditions
© 2023. The Author(s). Published by the American Astronomical Society.