Image Details
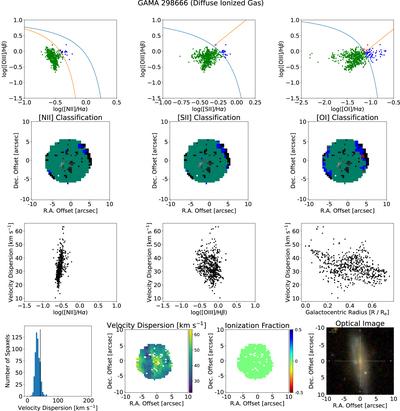
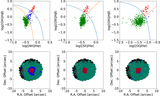
Caption: Figure 11.
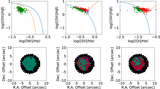
Emission-line diagnostics and maps for GAMA 298666, a galaxy containing diffuse ionized gas. Each panel in the first row shows the emission-line diagnostics colored according to where each spaxel falls in its respective diagram: green for star-forming, blue for composite or LINER, and red for AGN. Below each diagnostic is the corresponding spatial map showing where in the galaxy the points in the diagram above are located. The middle row contains plots of log([N II]/Hα), log([O III]/Hβ), and effective radius vs. velocity dispersion. As our method classifies all of the spaxels as being dominated by star formation, all of the points here are labeled black. The last row contains a histogram of the velocity dispersion with a vertical line denoting the two components in velocity dispersion space, a map of the velocity dispersion in the middle, a spatial map showing that there is no ionization contribution from non-star-forming sources, and a three-color image on the right matching the FOV of the SAMI data.
Other Images in This Article
Show More
Copyright and Terms & Conditions
© 2023. The Author(s). Published by the American Astronomical Society.