Image Details
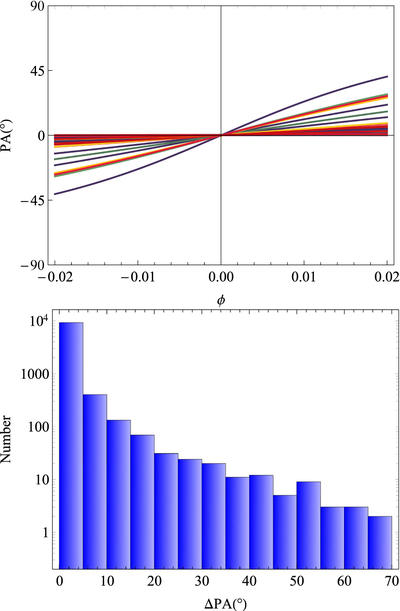
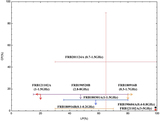
Caption: Figure 8.
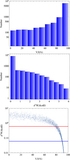
Simulated polarization angle evolution and variation for each pulse. The upper panel denotes the simulated PA evolution. The different lines denote the flatter PA evolution within the burst phases for φ < φ t . The bottom panel denotes simulated PA variation. The parameters are adopted as follows: α = π/6, ζ = π/4, γ = 100, ρ = 107 cm.
Other Images in This Article
Copyright and Terms & Conditions
© 2023. The Author(s). Published by the American Astronomical Society.
Copyright ©
2025 Astronomy Image Explorer. All Rights Reserved.