Image Details
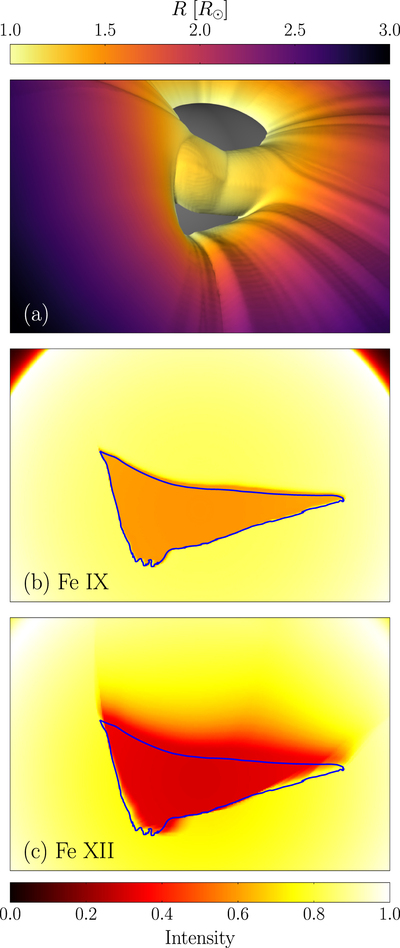
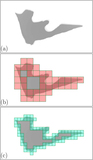
Caption: Figure 2.
(a) Visualization of the last closed-flux surface around the Sun (gray sphere) in the vicinity of the midlatitude coronal hole. The viewing perspective is from approximately the top-right corner of Figure 1. Magnetic field lines inside the surface are closed, while any field line connected to the two visible coronal holes is open. Synthetic emission from atomic iron with charge states (b) Fe IX and (c) Fe XII at the beginning of the simulation. The lower end of the intensity scale is identically zero in all cases, while its upper end has been adjusted for each charge state. The images of synthetic emission are along the same axis but zoomed in relative to panel (a). The difference in intensity between the coronal hole and the surrounding regions arises due to the higher density and temperature of the plasma in the closed-field region. The blue lines indicate the coronal hole boundary, where the last closed-flux surface intersects the photosphere.
Other Images in This Article

Copyright and Terms & Conditions
© 2022. The Author(s). Published by the American Astronomical Society.