Image Details
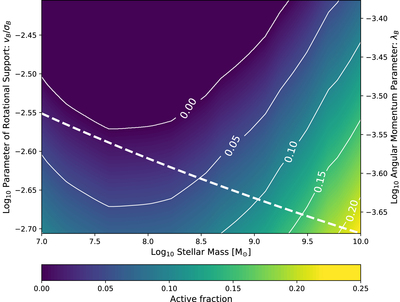
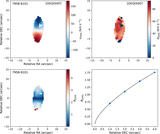
Caption: Figure 4.
Predicted active fraction shown as a function of M ⋆, in terms of ﹩{ \mathcal R }﹩ on the left axis and in terms of λ B on the right axis. The parameter of rotational support ﹩{ \mathcal R }﹩ is in the range estimated from observations by assuming a value of the angle θ ∼ 5°. The dashed lines indicate the preferred relation between M ⋆ and (﹩{ \mathcal R }﹩, λ B), calculated by calibrating our model against the X-ray detected fraction. The solid white lines are the contour levels for the active fraction. Note that the left axis is obtained by rescaling the right axis by a factor ﹩\sqrt{2/3}/\sin \theta ﹩, with θ = 5°.
Other Images in This Article
Copyright and Terms & Conditions
© 2021. The American Astronomical Society. All rights reserved.