Image Details
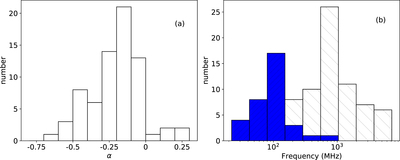
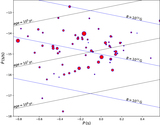
Caption: Figure 7.
Panel (a): fitting index α distribution of 71 pulsars with absorption features. Panel (b): frequency distributions of the start (blue histogram) at a low frequency and the end (white histogram) at a high frequency of absorption.
Other Images in This Article
Copyright and Terms & Conditions
© 2021. The American Astronomical Society. All rights reserved.
Copyright ©
2025 Astronomy Image Explorer. All Rights Reserved.