Image Details
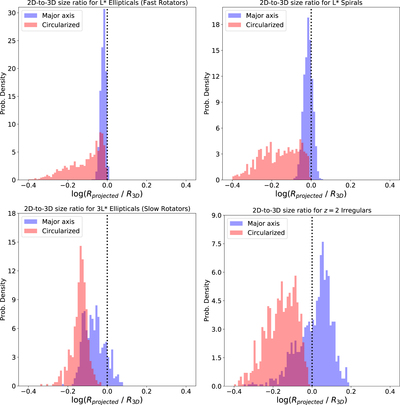
Caption: Figure 4.
Simulated distributions (1000 objects each) of projected-2D to intrinsic-3D size ratios for four different galaxy types. The intrinsic shape distributions of the four types are given in Table 1. The blue histograms represent projected major axis sizes (﹩a^{\prime} ﹩) compared to intrinsic median sizes (rmed), and red histograms show circularized sizes (Re).
Other Images in This Article
Copyright and Terms & Conditions
© 2021. The American Astronomical Society. All rights reserved.
Copyright ©
2025 Astronomy Image Explorer. All Rights Reserved.