Image Details
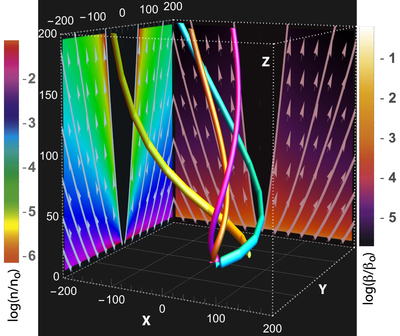
Caption: Figure 1.
Streamlines of a simulated MHD wind for p = 1.3 assuming a fiducial set of wind parameters launched from three different locations on the disk surface. The poloidal distribution of the normalized wind density ﹩\mathrm{log}(n/{n}_{o})﹩ and plasma beta ﹩\mathrm{log}(\beta /{\beta }_{o})﹩ (where βo is a maximum value) are shown in color, superimposed by the wind velocity vector v(r, θ) (white arrows) and poloidal projection of the magnetic field lines (white solid lines) in the innermost wind domain for −200Rg ≤ x ≤ 200Rg and −200Rg ≤ y ≤ 200Rg.
Other Images in This Article
Show More
Copyright and Terms & Conditions
© 2021. The American Astronomical Society. All rights reserved.
Copyright ©
2025 Astronomy Image Explorer. All Rights Reserved.