Image Details
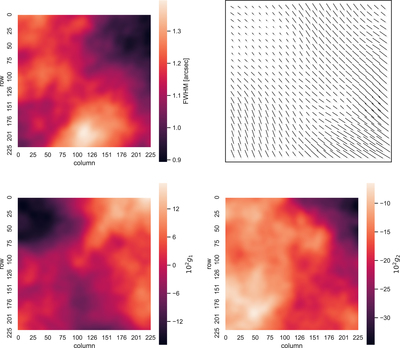
Caption: Figure A1.
Variable PSF model statistics for a DECam-like exposure. The top left panel shows the variation in the FWHM in arcseconds. The top right panel shows a visualization of the PSF ellipticity variation. The bottom left panel shows the variation in the 1-component of the PSF ellipticity. The bottom right panel shows the variation in the 2-component of the PSF ellipticity. The variation in this model is ≳10× larger than the typical PSF variation for either DECam or expected LSST observations. The pixel scale is 0.″263 so that each panel is approximately 1′ on a side.
Other Images in This Article
Copyright and Terms & Conditions
© 2020. The American Astronomical Society. All rights reserved.
Copyright ©
2025 Astronomy Image Explorer. All Rights Reserved.