Image Details
Caption: Figure 2.
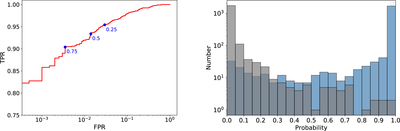
Left: ROC curve for the CNN classifier based on 4000 galaxies in the testing sample. We also show the locations of three different values of the threshold (pCNN = 0.25, 0.5, and 0.75) used to calculate the FPR and TPR. Right: probability distribution of the testing sample. The blue histogram represents the probability distribution of the positives, while the gray histogram shows that of the negatives.
Other Images in This Article
Copyright and Terms & Conditions
© 2020. The American Astronomical Society. All rights reserved.
Copyright ©
2025 Astronomy Image Explorer. All Rights Reserved.