

Image Details
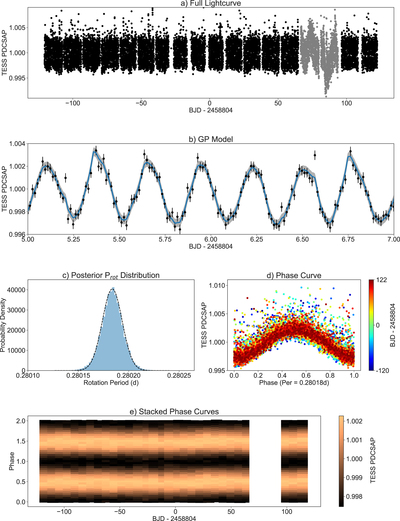
Caption: Figure 4.
Analysis of rotationally modulated TESS photometry of G227-22 from Sectors 14–22. Full lightcurve, binned and sigma-clipped, is shown in (a). Data from Sector 21 are shown in gray to indicate we have excluded them from our analysis. In (b), we show our GP model to the lightcurve for a representative segment of the time series. GP model is shown as a blue line, with the 1σ uncertainty region in gray. Panel (c) shows a histogram of the 1D posterior distribution for the rotation period, as well as a best-fit Gaussian model. Panel (d) shows the lightcurve folded to the 0.28018 day rotation period. Points are color-coded according to their timestamps, to show that the signal shows no significant evolution over TESS’s time baseline. In (e), we show stacked phase curves, median-binned into segments of 7 days and phase steps of 0.05. Again, we see no phase drift in the lightcurve.
Other Images in This Article
Copyright and Terms & Conditions
© 2020. The American Astronomical Society. All rights reserved.

