Image Details
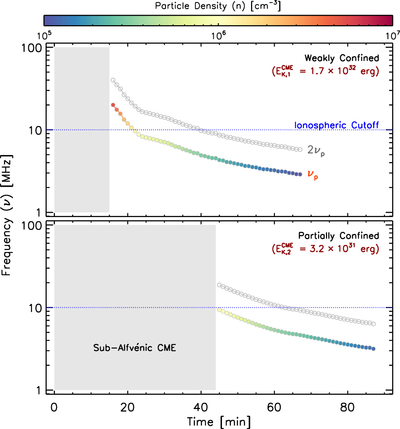
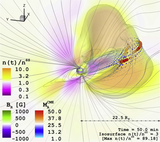
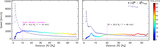
Caption: Figure 6.
Temporal evolution of the expected type II radio burst frequencies associated with the shock regions in our simulated M-dwarf CMEs (Top: weakly confined—Figure 3; bottom: partially confined—Figure 4). The fundamental (﹩{\nu }_{{\rm{p}}}\simeq 8980\sqrt{n}﹩ [Hz]) and first harmonic (2νp) of the plasma frequency are included. The associated ﹩{M}_{{\rm{A}}}^{\mathrm{CME}}-﹩ weighted mean plasma density is indicated by the color scale. Gray regions denote the intervals in which each CME is within the sub-Alfvénic regime (see Figure 5).
Other Images in This Article
Copyright and Terms & Conditions
© 2020. The American Astronomical Society. All rights reserved.
Copyright ©
2026 Astronomy Image Explorer. All Rights Reserved.