Image Details
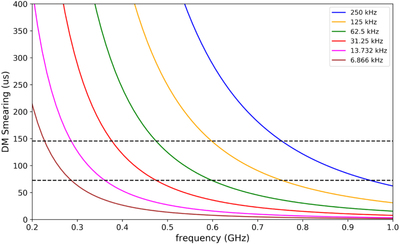
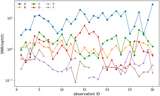
Caption: Figure 1.
DM smearing as a function of frequency. The colored lines are different channel bandwidths corresponding to different numbers of channels. The brown and purple lines correspond to the numbers of channels we used in the two subbands.
Other Images in This Article
Copyright and Terms & Conditions
© 2020. The American Astronomical Society. All rights reserved.
Copyright ©
2026 Astronomy Image Explorer. All Rights Reserved.