Image Details
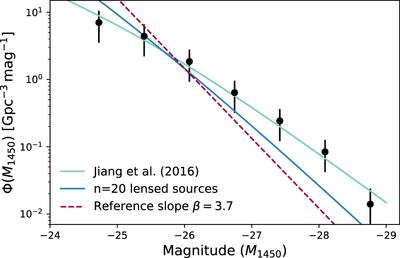
Caption: Figure 4.
Example of the lensing effect on the quasar LF for a number i = 20 of lensed quasars in the SDSS sample. Black symbols are data from Jiang et al. (2016); the green line being their best fit, and the blue line being the quasar LF that we obtain assuming that additional 20 randomly chosen quasars in the sample are magnified. The red dashed line indicates a slope ﹩\beta =3.7﹩, for reference.
Other Images in This Article
Copyright and Terms & Conditions
© 2020. The American Astronomical Society. All rights reserved.
Copyright ©
2025 Astronomy Image Explorer. All Rights Reserved.