Image Details
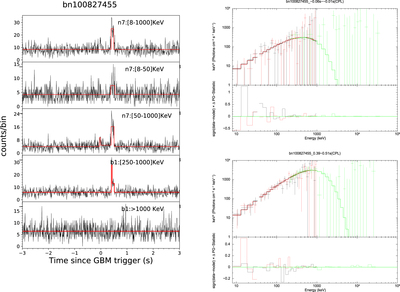
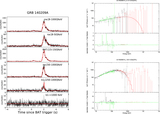
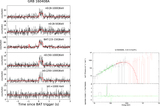
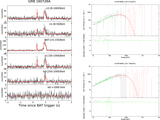
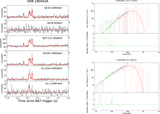
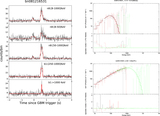
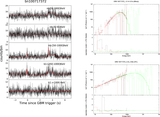
Caption: Figure 3.
Left panel: SGRB light curves with precursors observed by only Fermi, as identified by the BBlocks analysis. Right panel: the better-fitting spectra (CPL or BB model) for precursors (top) and main bursts (bottom). The red and black, and green points are data observed with Fermi NaI, and BGO, respectively.
1 of 6 images
Other Images in This Article
Show More
Copyright and Terms & Conditions
© 2019. The American Astronomical Society. All rights reserved.
Copyright ©
2024 Astronomy Image Explorer. All Rights Reserved.