Image Details
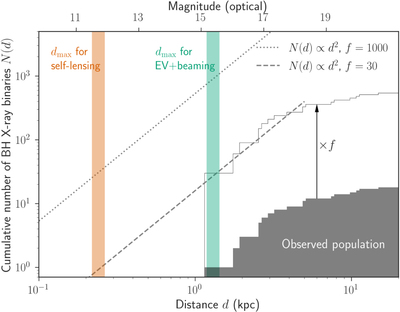
Caption: Figure 7.
Estimates for the cumulative distribution of distance d to X-ray binaries with BHs, N(d). Maximum searchable distances ﹩{d}_{\max }﹩ for the self-lensing and phase-curve signals are also shown for ﹩{M}_{\bullet }=7\,{M}_{\star }﹩, ﹩P=0.8\,\mathrm{day}﹩, and ﹩{M}_{\star }=1\,{M}_{\odot }﹩ (vertical bands). The value of ﹩N({d}_{\max })﹩ corresponds to the number of systems whose optical signals would be detectable with TESS assuming no other source of optical signal. The gray histogram in the bottom right is for the observed BHXB sample, and thin histogram is the distribution inflated by a factor of f to take into account the incompleteness of the X-ray binary detection. The dashed and dotted lines show the extrapolation of this distribution for f = 30 and f = 1000, respectively, assuming ﹩N(d)\propto {d}^{2}﹩.
Other Images in This Article

Copyright and Terms & Conditions
© 2019. The American Astronomical Society. All rights reserved.