Image Details
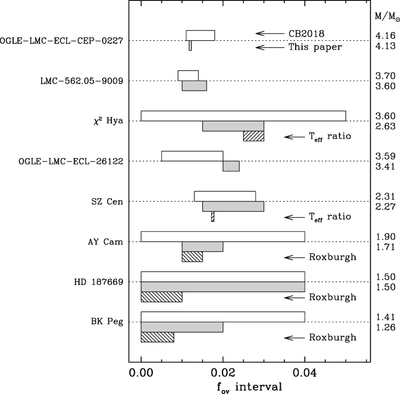
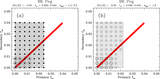
Caption: Figure 9.
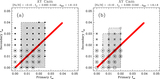
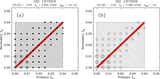
Comparison between the acceptable ranges for the overshooting parameter from CB2018 (white rectangles) and from our own grids (gray rectangles) assuming the same values of ﹩{f}_{\mathrm{ov}}﹩ for the primary and secondary, and under closely similar conditions regarding ﹩{\alpha }_{\mathrm{MLT}}﹩. Systems are in the same order as discussed previously, and primary and secondary masses in solar units are indicated on the right. The hatched rectangles for χ2 Hya and SZ Cen represent the much reduced ranges we obtain by adding the constraint from the temperature ratio (see previous section). For the three lower-mass systems AY Cam, HD 187669, and BK Peg, the hatched areas result from considering the maximum plausible values of ﹩{f}_{\mathrm{ov}}﹩ from theory (Roxburgh 1992) (see Appendix).
Other Images in This Article
Show More
Copyright and Terms & Conditions
© 2019. The American Astronomical Society. All rights reserved.