Image Details
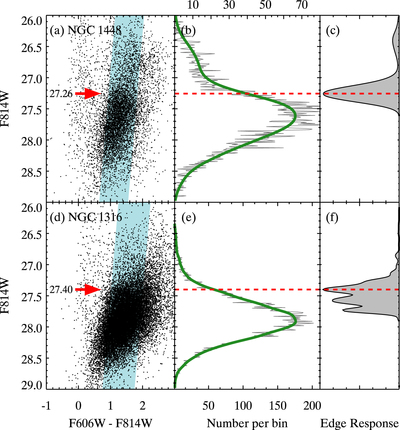
Caption: Figure 4.
TRGB edge detection for NGC 1448 and NGC 1316. Panels (a) and (d) display the CMDs. A red arrow in each plot shows the location of the measured TRGB. Panels (b) and (e) show the binned luminosity functions in 0.01 mag intervals in gray and the GLOESS-smoothed luminosity functions in solid green. Panels (c) and (f) show the response function of the [−1, 0, +1] kernel on the smoothed luminosity functions. These functions are scaled so that their peaks align. A dashed line passes through the location of the greatest change in the luminosity functions.
Other Images in This Article

Copyright and Terms & Conditions
© 2018. The American Astronomical Society. All rights reserved.
Copyright ©
2025 Astronomy Image Explorer. All Rights Reserved.