Image Details
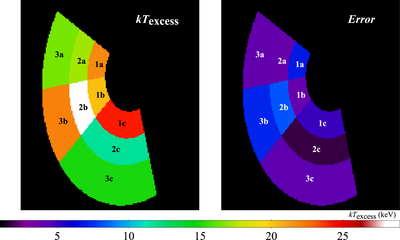
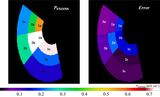
Caption: Figure 4.
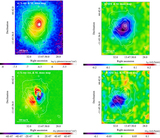
Temperature (left) and average of its statistical error (right) maps of the excess component (kTexcess) in nine regions in units of keV. All the best-fit values are the same as in Table 1, while the error values are the average of upper and lower statistical errors of each region.
Other Images in This Article

Copyright and Terms & Conditions
© 2018. The American Astronomical Society. All rights reserved.
Copyright ©
2026 Astronomy Image Explorer. All Rights Reserved.