Image Details
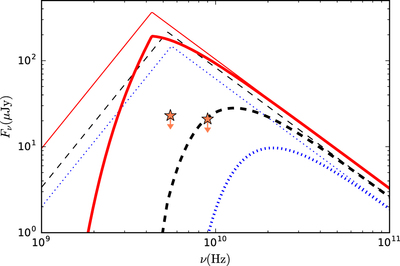
Caption: Figure 3.
Model synchrotron spectrum in comparison with the radio limits from observations. The thick (thin) lines represent synchrotron flux with (without) free–free absorption taken into account. Three cases satisfying X-ray constraints are as marked as black solid points in Figure 2, ﹩({A}_{38},{\beta }_{0,-2})=(0.6,3)﹩ (red solid lines), (1.0, 1.9) (black dashed lines), and (1.2, 1.5) (blue dotted lines). The other parameters used are ﹩{\epsilon }_{B}=0.1﹩, ﹩{\epsilon }_{{\rm{e}}}=0.1﹩, p = 3, and ﹩{T}_{{\rm{e}}}=2.0\times {10}^{4}\,{\rm{K}}﹩.
Other Images in This Article
Copyright and Terms & Conditions
© 2018. The American Astronomical Society. All rights reserved.
Copyright ©
2025 Astronomy Image Explorer. All Rights Reserved.