

Image Details
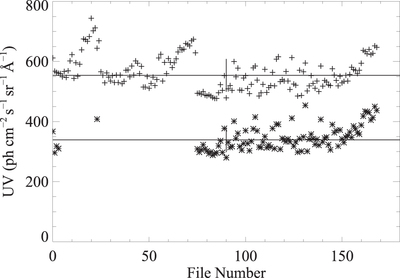
Caption: Figure 3.
Median values for FUV (*) and NUV (+) in each visit. The horizontal lines show the medians in each band over all visits with the standard deviation plotted as vertical lines in the center of the plot. Many FUV values are missing because there were no observations on those dates.
Other Images in This Article
Show More
Copyright and Terms & Conditions
© 2018. The American Astronomical Society. All rights reserved.

Copyright ©
2026 Astronomy Image Explorer. All Rights Reserved.
