Image Details
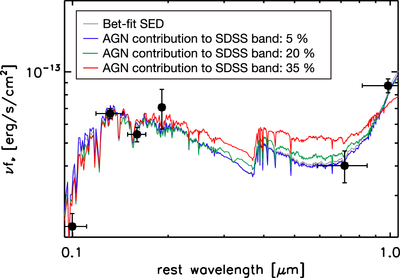
Caption: Figure 6.
Influence of AGN contribution to the optical bands on the SED fitting. The black circles represent the flux at SDSS g-, r-, i-, z-band, and WISE 3.4 and 4.6 μm. The gray line represents the best-fit SED without adopting any prior probability of AGN flux contribution to the optical bands (see Figure 2). The blue, green, and red lines represent the resultant SED when assuming 5%, 20%, and 35% contributions of AGN flux to the optical bands as a prior probability, respectively.
Other Images in This Article
Copyright and Terms & Conditions
© 2018. The American Astronomical Society. All rights reserved.
Copyright ©
2025 Astronomy Image Explorer. All Rights Reserved.