Image Details
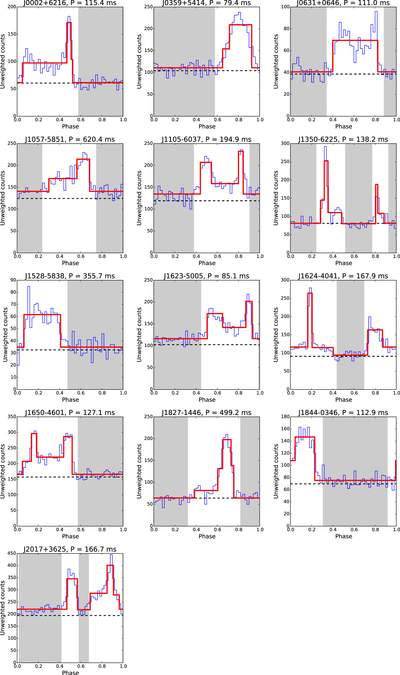
Caption: Figure 1.
Results of the decomposition of gamma-ray pulse profiles into Bayesian blocks, as discussed in Section 4.1. Blue histograms represent the pulse profiles, red lines the Bayesian block decompositions, and shaded regions the off-pulse phase intervals determined from this analysis. Dashed black lines represent the estimated background levels, calculated as ﹩B={\sum }_{i}^{N}(1-{w}_{i})﹩, where wi is the weight associated with photon i (Guillemot et al. 2012b).
Other Images in This Article
Copyright and Terms & Conditions
© 2018. The American Astronomical Society. All rights reserved.
Copyright ©
2025 Astronomy Image Explorer. All Rights Reserved.