Image Details
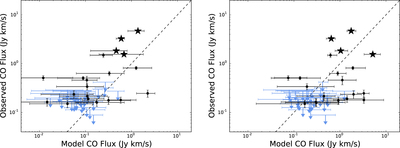
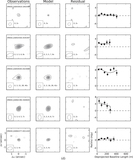
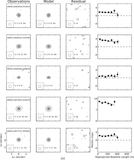
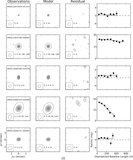
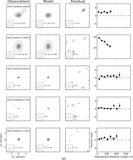
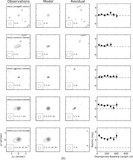
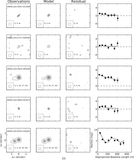
Caption: Figure 3.
Observational and model fluxes for CO ﹩J=3\mbox{--}2﹩ emission for sources detected in the continuum, for models with (left panel) and without (right panel) photodissociation. Model fluxes were calculated based on the expected CO emission given the disk dust properties, as discussed in Section 4.2. CO detections are shown as black points, while upper limits are shown with blue arrows. The four well-constrained sources with larger CO outer radii than dust outer radii are shown as stars. Horizontal error bars represent the 68.3% confidence range for the model fluxes. The dashed line represents agreement between the model and observed fluxes.
Other Images in This Article
Show More
Copyright and Terms & Conditions
© 2017. The American Astronomical Society. All rights reserved.