Image Details
Caption: Figure 2.
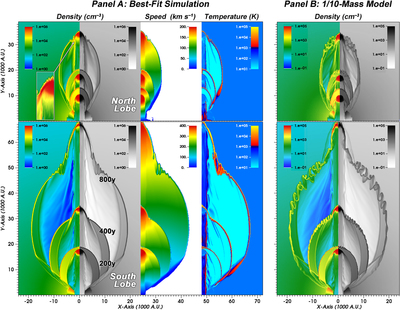
Panel A: best-fitting simulations of OH231 200, 400, and 800 yr after the clump and spray are launched. Two left panels: two complementary representations of the model density distribution. Two right panels: the radial flow speed and temperature. Parameters of the model are found in Table 1. The inset shows the trail of gas being shed into the spine as the clump is crushed. It applies also to the southern clump at t ≈ 200 yr. Note that the color bars for the speed panels differ for the north and south lobes. Panel B: Like panel A, but for the density distribution of a simulation where all of the initial densities (and the total mass) are reduced by a factor of 10. It demonstrates that the outcomes of isoflow models can have similar large-scale outcomes.
Other Images in This Article

Copyright and Terms & Conditions
© 2017. The American Astronomical Society. All rights reserved.