Image Details
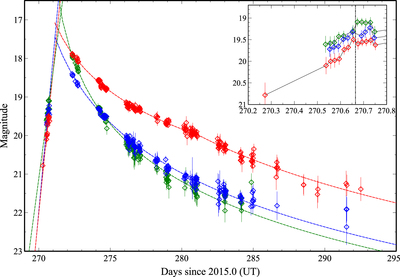
Caption: Figure 2.
Multi-color evolution of KSP-OT-201509a. Blue, green, and red points represent measurements in B, V, and I respectively. The dashed lines show the best-fit power-law decay trends (﹩{F}_{{\rm{v}}}\propto {t}^{-\alpha }﹩). The inlet figure shows the rising phase in more detail. The vertical line at UT 270.67 indicates the approximate onset of the pre-maximum halt.
Other Images in This Article

Copyright and Terms & Conditions
© 2017. The American Astronomical Society. All rights reserved.
Copyright ©
2025 Astronomy Image Explorer. All Rights Reserved.