Image Details
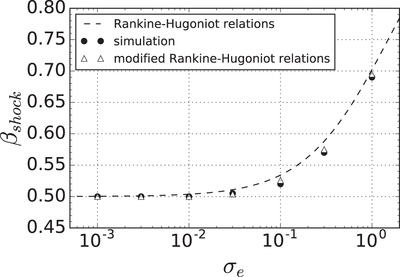
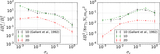
Caption: Figure 15.
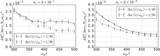
Comparison of the shock velocity measured in simulations with the Rankine–Hugoniot relations. The dashed line shows the ideal MHD Rankine–Hugoniot prediction. The filled circles and open triangles show the measured shock velocity, and the shock velocity obtained by the modified Rankine–Hugoniot conditions, respectively.
Other Images in This Article
Show More
Copyright and Terms & Conditions
© 2017. The American Astronomical Society. All rights reserved.
Copyright ©
2026 Astronomy Image Explorer. All Rights Reserved.