Image Details
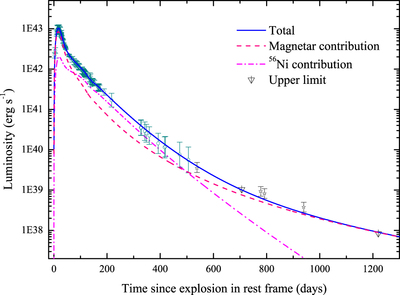
Caption: Figure 1.
Best-fit light curve (solid line) of SN 1998bw. The dashed line (the magnetar contribution) is the light curve with ﹩{M}_{\mathrm{Ni}}=0﹩, while other parameters take the same values as the solid line. The dotted–dashed line is the difference between these two light curves, i.e., the 56Ni contribution. The data points (﹩t\lt 506\,\mathrm{days}﹩) are taken from Patat et al. (2001). In this figure we do not try to fit the dark star data points and the two upper limits. They are taken from Sollerman et al. (2002) and afterward shifted upward by ﹩0.6\,\mathrm{dex}﹩ and plotted here just for eye guidance. See the text for a more detailed explanation.
Other Images in This Article

Copyright and Terms & Conditions
© 2017. The American Astronomical Society. All rights reserved.