Image Details

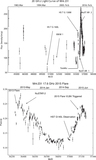
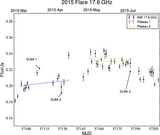
Caption: Figure 12.
Top panel compares the SEDs of the two high-radio states, the 2011 flare and the 2015 flare. The middle panel compares the SED during the 2015 flare and during the radio-low state in 1996. There is C IV BAL absorption and a harder spectrum in 1996. The last frame compares the SED in 1996 and during the radio flare in 2011. The SEDs diverge shortward of ﹩1400\,\mathring{\rm A} ﹩.
Other Images in This Article
Show More
Copyright and Terms & Conditions
© 2017. The American Astronomical Society. All rights reserved.
Copyright ©
2024 Astronomy Image Explorer. All Rights Reserved.