Image Details
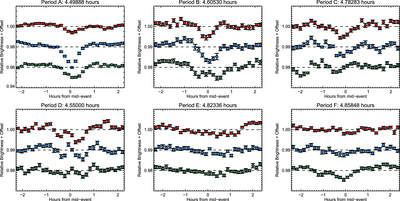
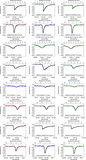
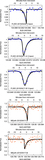
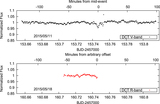
Caption: Figure 12.
K2 photometry of WD 1145+017 folded on the Vanderburg et al. (2015) A–F periods as indicated at the top of each panel. The red circles represent the first third (∼26.6 ﹩\mathrm{day}﹩) of the K2 photometry, while the second and third ∼26.6 ﹩\mathrm{day}﹩ stretches of K2 photometry are represented by the blue and green circles, respectively. The data are binned every ∼0.033 in phase, and the various light curves are vertically offset for clarity.
Other Images in This Article
Show More
Copyright and Terms & Conditions
© 2017. The American Astronomical Society. All rights reserved.
Copyright ©
2025 Astronomy Image Explorer. All Rights Reserved.