Image Details
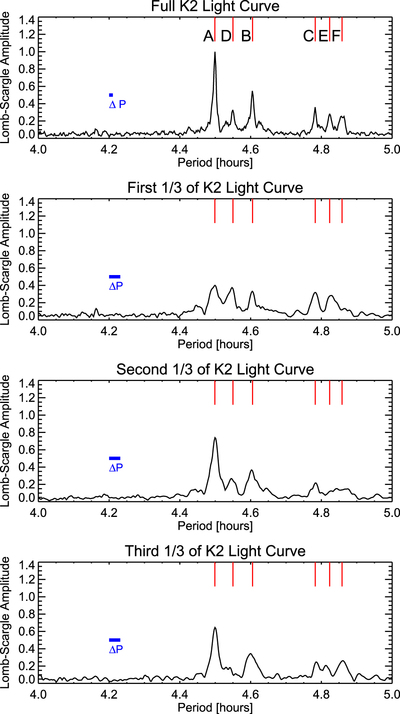
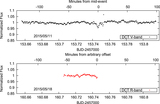
Caption: Figure 11.
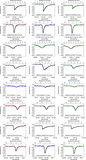
Summed Lomb–Scargle (LS) periodogram analysis of the K2 photometry of WD 1145+017 (top panel), and the K2 photometry split in three equal ∼26.6 ﹩\mathrm{day}﹩ sections (bottom three panels). The vertical red dashes denote the A–F periods of Vanderburg et al. (2015). The horizontal blue line marked “﹩{\rm{\Delta }}P﹩” denotes the frequency resolution of the LS periodogram given by ﹩{\rm{\Delta }}P﹩ = 1/T, where T is the duration of the photometry (80 ﹩\mathrm{day}﹩ in the top panel, and ∼26.6 ﹩\mathrm{day}﹩ in the bottom panels).
Other Images in This Article
Show More
Copyright and Terms & Conditions
© 2017. The American Astronomical Society. All rights reserved.
Copyright ©
2025 Astronomy Image Explorer. All Rights Reserved.