Image Details
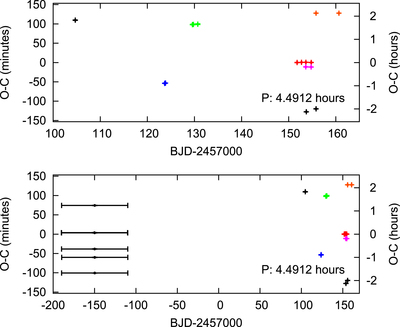
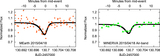
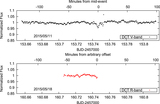
Caption: Figure 10.
Transit-timing analysis (the black and colored points) phased to a period, P = 4.4914 ﹩\mathrm{hr}﹩, using the mid-transit times, ﹩{T}_{\min }﹩, and associated errors from Table 2. The top panel features only the ground-based transit detections, while the bottom panel includes the six K2 detections from Vanderburg et al. (2015). The x-error bars in the bottom panel signify that those data-points are averages over the ∼80 days of K2 data. Multiple separate groups of transits (four transits denoted with red points, three transits denoted with green points, two transits denoted with with blue points, two transits denoted with magenta points, and two transits denoted with orange points) appear to phase with a ∼4.5 ﹩\mathrm{hr}﹩ period, which is near the “A” period of Vanderburg et al. (2015).
Other Images in This Article
Show More
Copyright and Terms & Conditions
© 2017. The American Astronomical Society. All rights reserved.