Image Details
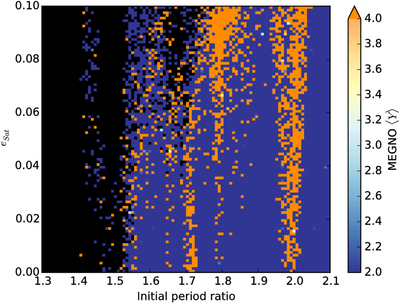
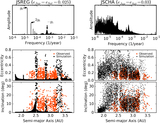
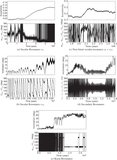
Caption: Figure 6.
A dynamical map of chaos in Jupiter’s and Saturn’s orbits as a function of their initial orbital period ratio. The vertical axes show the initial eccentricity of Saturn (Jupiter’s initial eccentricity was randomly chosen between zero and 0.01). The horizontal axes show the initial period ratio between Jupiter and Saturn. Each dynamical state is color-coded showing the MEGNO value after 50 Myr of integration. Black is used to denote orbits where Jupiter and Saturn’s mutual distance gets smaller than 1 au. Because we use a symplectic integrator, these orbits would not be solved properly in this case. Bluish colors show regular or quasi-periodic motion while orange-ish colors show chaotic orbits.
Other Images in This Article
Show More
Copyright and Terms & Conditions
© 2016. The American Astronomical Society. All rights reserved.