Image Details
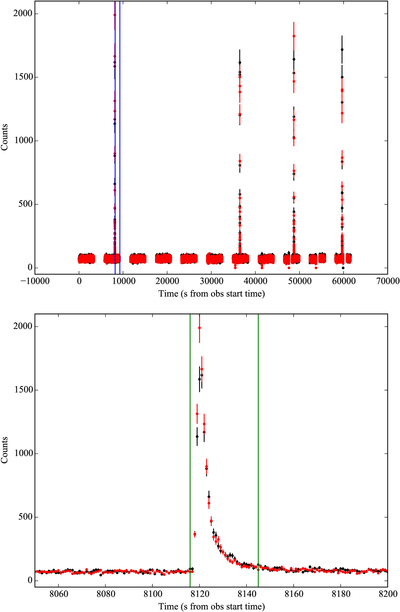
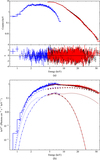
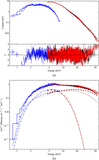
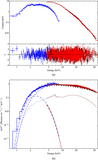
Caption: Figure 2.
(a) NuSTAR FPMA (black) and FPMB (red) light curve, including the four type I X-ray bursts. The time of the Swift observation is marked in blue. (b) A close-up of the first type I X-ray burst. The green lines indicate the data removed for spectral analysis.
Other Images in This Article
Copyright and Terms & Conditions
© 2016. The American Astronomical Society. All rights reserved.
Copyright ©
2025 Astronomy Image Explorer. All Rights Reserved.