Image Details
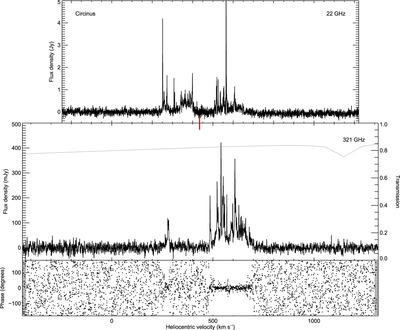
Caption: Figure 2.
H2O megamaser spectra of Circinus. Top: a reproduction of the 22 GHz spectrum taken with the 64 m Parkes telescope in 1998 August from Braatz et al. (2003). Because we restricted the vertical axis range to more easily show the weaker features, the strongest feature (peaking at ∼18 Jy) was cut off. Middle: 321 GHz spectrum extracted from the continuum-subtracted data cube. The channel width is 0.5 km s−1. The atmospheric transmission curve, corresponding to a precipitable water vapor level matching that present during the observation, is overplotted in light gray. Atmospheric transmission curves were taken from the Atacama Pathfinder Experiment (APEX) transmission calculator (http://www.apex-telescope.org/sites/chajnantor/atmosphere/). The recession velocity of the galaxy is marked by a vertical red line. Bottom: phase plot for the calibrated 321 GHz spectrum.
Other Images in This Article
Copyright and Terms & Conditions
© 2016. The American Astronomical Society. All rights reserved.