Image Details
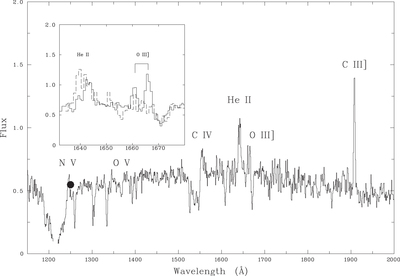
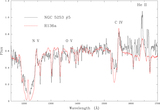
Caption: Figure 3.
Merged STIS and FOS spectrum of cluster #5 over the wavelength range 1150–2000 Å. The inset plot shows the overlap region covering the He II λ1640 emission feature for the STIS (solid line) and FOS (dashed line) spectra. The main stellar features and nebular emission lines are identified. The filled circle represents the measured luminosity density in the F125LP filter for cluster #5 from Calzetti et al. (2015). The flux is in units of 10−15 erg cm−2 s−1 Å−1.
Other Images in This Article
Copyright and Terms & Conditions
© 2016. The American Astronomical Society. All rights reserved.
Copyright ©
2025 Astronomy Image Explorer. All Rights Reserved.