Image Details
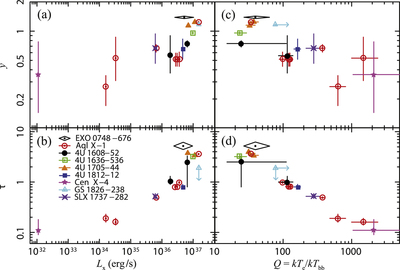
Caption: Figure 4.
﹩{L}_{{\rm{X}}}﹩–y (panel a) and ﹩{L}_{{\rm{X}}}﹩–τ (panel b) plots for the Comptonization of the NS blackbodies in the LHS LMXBs given in Table 3. Panels (c) and (d) give Q–y and Q–τ plots, respectively.
Other Images in This Article

Copyright and Terms & Conditions
© 2016. The American Astronomical Society. All rights reserved.
Copyright ©
2025 Astronomy Image Explorer. All Rights Reserved.