Image Details
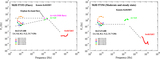
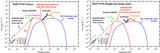
Caption: Figure 1.
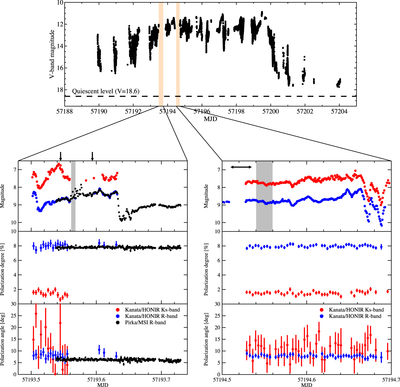
Top: V-band light curve of V404 Cyg during the most active phase in 2015 June (taken from Kimura et al. 2016). Horizontal dashed line indicates the quiescent flux level of V = 18.6 (Wagner et al. 1991). The hatched orange rectangles indicate the Kanata/HONIR observation periods shown in detail in the bottom multipanel plots. Bottom left panels: Kanata/HONIR and Pirka/MSI polarimetric observations in MJD 57193. Note that the R-band magnitudes shown in the first panel are offset by 3.0 mag for illustrative purposes (i.e., the actual R-band magnitudes are 3.0 mag fainter). The two black arrows and gray rectangle in the first panel indicate the time ranges when Kanata/HONIR ﹩{{VRIJHK}}_{s}﹩ and Swift/XRT X-ray spectra were constructed, respectively (see also left panels in Figures 5 and 6). Bottom right panels: same as bottom left panels, but for the data in MJD 57194. A black horizontal arrow indicates the period when Kanata/HONIR multiband polarimetric observations were performed (see also Figure 4 and right panels of Figures 5 and 6).
Other Images in This Article
Copyright and Terms & Conditions
© 2016. The American Astronomical Society. All rights reserved.