Image Details
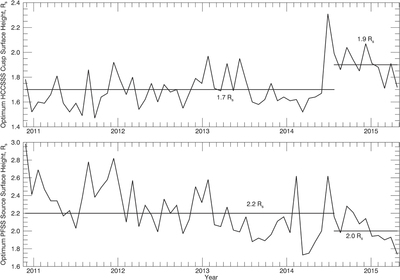
Caption: Figure 3.
Interpolated optimum HCCSSS cusp surface heights (top plot) and PFSS source surface heights (bottom plot) in units of solar radii. These values give the best match to the IMF open flux for each CR. Also shown are reference lines corresponding to the overall values chosen for each epoch on the basis of minimum rms difference between IMF and coronal model (see Table 2).
Other Images in This Article
Copyright and Terms & Conditions
© 2016. The American Astronomical Society. All rights reserved.
Copyright ©
2025 Astronomy Image Explorer. All Rights Reserved.