Image Details
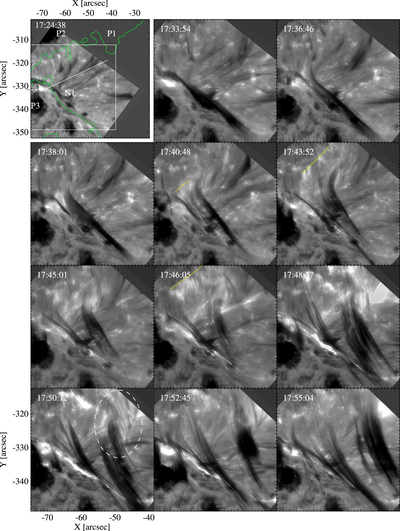
Caption: Figure 7.
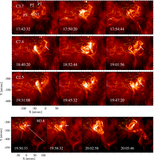
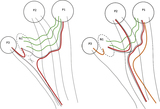
Time series of NST Hα − 0.7 Å images for the C3.7 flare. A green curve in the first panel represents the PIL, and a white line represents the slit position along which the spacetime plot was computed. Yellow curves indicate the position of sequential brightenings near the footpoints of curtain-like structure.
(An animation of this figure is available.)
The video/animation of this figure is available in the online journal.
Other Images in This Article
Copyright and Terms & Conditions
© 2016. The American Astronomical Society. All rights reserved.
Copyright ©
2025 Astronomy Image Explorer. All Rights Reserved.