Image Details
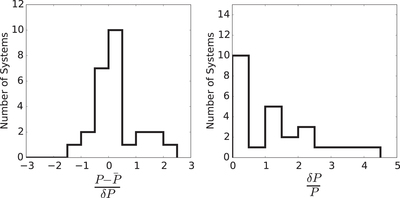
Caption: Figure 5.
Left: distribution of the difference between the period estimated from individual transit (﹩\bar{P})﹩ and the period estimated from the time interval of consecutive transits (P) for 24 candidate planetary systems with 2–3 visible transits. The difference is normalized by measurement uncertainty of δP. Right: distribution of the fractional error δP/P.
Other Images in This Article
Copyright and Terms & Conditions
© 2015. The American Astronomical Society. All rights reserved.
Copyright ©
2026 Astronomy Image Explorer. All Rights Reserved.