Image Details
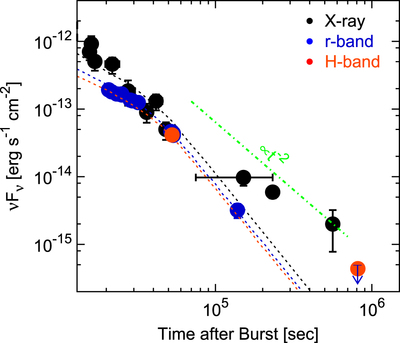
Caption: Figure 1.
Observed light curves of GRB 130603B. Black, blue, and red denote the X-ray (1 keV), optical (r-band), and infrared (H-band), respectively. The data and the lines of the afterglow model are taken from Fong et al. (2014; some of them originate from Berger et al. 2013; Cucchiara et al. 2013; Tanvir et al. 2013; de Ugarte Postigo et al. 2014). We use the optical and infrared fluxes corrected by the extinction of the host galaxy in Fong et al. (2014). The green dotted–dashed line shows L ∝ t−2, on which the X-rays give the same contribution to the macronova emission. After the jet break time ﹩t\gtrsim 4\times {10}^{4}\;{\rm{s}}﹩, the X-ray and infrared fluxes are in comparable excesses of the extrapolated power laws based on the optical emission.
Other Images in This Article
Copyright and Terms & Conditions
© 2016. The American Astronomical Society. All rights reserved.