Image Details
Caption: Figure 5.
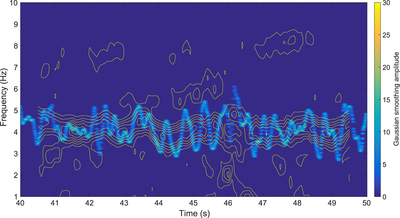
Resultant Hilbert spectrum of the 4-Hz LFQPO from XTE J1550–564. The amplitude is smoothed by a Gaussian filter for clarity. The contour plot is the Lomb–Scargle spectrogram, presented for comparison.
Other Images in This Article

Copyright and Terms & Conditions
© 2015. The American Astronomical Society. All rights reserved.
Copyright ©
2025 Astronomy Image Explorer. All Rights Reserved.