Image Details

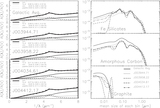
Caption: Figure 3.
Extinction curves for the target sample using the best fits with atmosphere models. The extinction curves are J003944.71+402056.2 (upper left), J003958.22+402329.0 (upper right), J004034.61+404326.1 (lower left), and J004412.17+413324.2 (lower right). The black line is the extinction curve using STIS spectra, and the black squares are UBVRI. Shown for comparison are the SMC average extinction curve (blue), the LMC (30-Dor) average extinction curve (green), and the MW CCM R(V) = 3.1 (red). The best fit to the FM parameters, listed in Table 5, is represented by the red dashed line.
Other Images in This Article
Copyright and Terms & Conditions
© 2015. The American Astronomical Society. All rights reserved.
Copyright ©
2025 Astronomy Image Explorer. All Rights Reserved.