Image Details
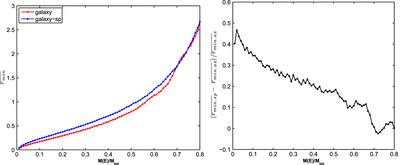
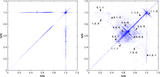
Caption: Figure 9.
Left panel shows ﹩\bar{{r}_{\mathrm{min}}}﹩, the average pericentric distance in each mass bin, as a function of mass fraction. The blue line is for the Galaxy-sp model and the red line is for the Galaxy model. The right panel quantifies the difference between the pericentric distance in each model: ﹩(\bar{{r}_{\mathrm{min},\mathrm{sp}}}\ -\bar{{r}_{\mathrm{min},\mathrm{ax}}}\ )/\bar{{r}_{\mathrm{min},\mathrm{ax}}}﹩, as a function of mass fraction. Inside around 70% mass fraction, this difference is always over 10%, reaching nearly 50% at mass fraction of 2%.
Other Images in This Article
Copyright and Terms & Conditions
© 2015. The American Astronomical Society. All rights reserved.
Copyright ©
2025 Astronomy Image Explorer. All Rights Reserved.