Image Details
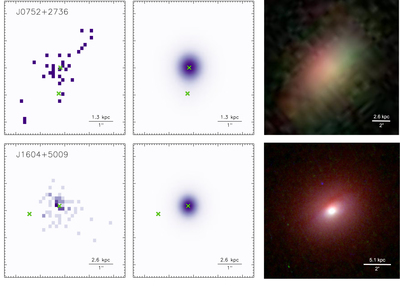
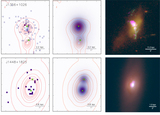
Caption: Figure 2.
Chandra 0.3–8 keV observations (left), model to the Chandra observations (middle), and imaging (right) for the two dual AGN candidates that were not a part of our HST program. In all panels, north is up and east is to the left. The left and middle panels are ﹩5\prime\prime \times 5\prime\prime ﹩ images centered on the coordinates of each SDSS spectrum. The left panels show one-fourth size Chandra pixels (purple) and best-fit locations of two X-ray sources (green crosses) that coincide within 3σ to the locations of two observed [O III] λ5007 components. The middle panels show the model fits to the two X-ray sources (purple) and the locations of two X-ray sources (green crosses). The right panels show an SDSS gri color composite image (top) and an archival HST image (red: F105W; green: F621M; blue: F547M; GO 12521, PI: Liu; bottom).
Other Images in This Article
Copyright and Terms & Conditions
© 2015. The American Astronomical Society. All rights reserved.