Image Details
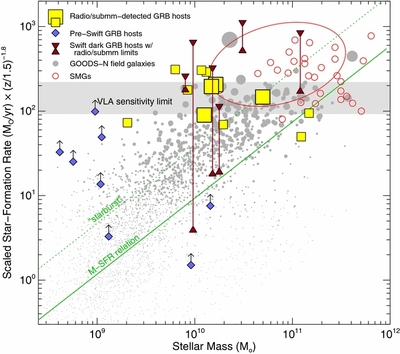
Caption: Figure 5.
Stellar masses and star formation rates of GRB host galaxies and field galaxies from our sample and from the literature at 0.8 < z < 2.2. In addition to the four radio-detected targets presented here (large squares), we plot GRB hosts with FIR/submillimeter/radio detections from Michałowski et al. (2008) and Hunt et al. (2014) (small squares), as well as events from Perley & Perley (2013) that were not detected at radio wavelengths, showing the range between the UV/optical SFR as a minimum and the radio SFR as a maximum in the form of vertical lines. Pre-Swift GRB hosts are also shown, plotted as lower limits since sensitive radio/submillimeter limits are generally not available. For the GOODS-N field galaxies (Kajisawa et al. 2011) we take 24 μm SFRs when available or dust-corrected UV SFRs otherwise, correcting by an IMF adjustment factor of 1.6 to convert from Salpeter to Chabrier/Kroupa. To minimize the impact of redshift evolution and varying radio luminosity sensitivity over this broad interval, we have scaled all SFRs by a factor of (z/1.5)−1.8. The galaxy M − SFR relation at z = 1–2 (Elbaz et al. 2007; Daddi et al. 2007) is also shown; galaxies with sSFRs a factor of five above this relation are defined as "starbursts" (Rodighiero et al. 2011). Compared to field galaxies of comparable luminosities and compared to SMGs (small circles indicate individual systems from Michałowski et al. 2010; the large red ellipse represents the region of parameter space inhabited by SMGs in Gruppioni et al. 2013), the most luminous GRB hosts have unusually low stellar masses.
Other Images in This Article
Copyright and Terms & Conditions
© 2015. The American Astronomical Society. All rights reserved.