Image Details
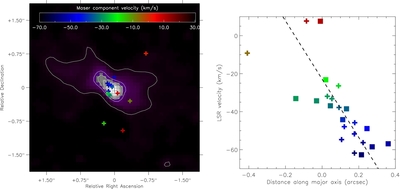
Caption: Figure 2.
Left: water maser components (colored crosses) in the 2011 August data, plotted on an image the 12.81 μm ([Ne II] filter) presented by Lagadec et al. (2011). The color scale of the crosses represent the LSR velocity of the components. Coordinates are offsets with respect to the position of the radio continuum emission (marked with a black cross). The alignment between the radio data and the mid-IR image has been made assuming that the intensity peak of the latter coincides with the position of the radio continuum emission. Right: LSR velocity of the maser components vs. projected distance to the radio continuum emission, along the major axis of the maser structure (P.A. =56°). Crosses and closed squares represent the data on 2011 and 2012, respectively. Color code is the same as in the right panel. The dashed line represents the best linear fit to the plotted data, with distances weighted by the inverse squared positional uncertainty of each point.
Other Images in This Article
Copyright and Terms & Conditions
© 2015. The American Astronomical Society. All rights reserved.