Image Details
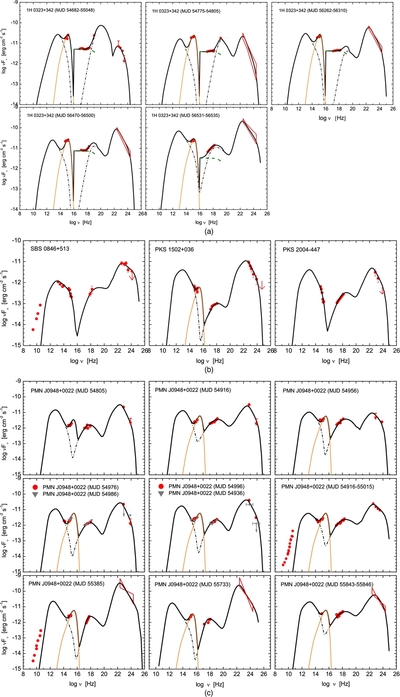
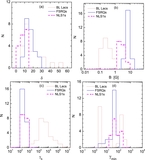
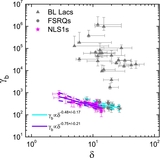
Caption: Figure 1.
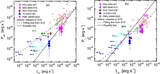
(a) Observed SEDs (red data points and bow ties) with the model best fits (lines) for 1H 0323+342 observed in five campaigns. The black thick solid lines are the sum of emission from the jet (dash–dotted lines), the accretion disk (orange thin solid lines), and the corona (magenta dashed lines). The steep rises in the black thick solid lines at 1016 Hz are due to the assumption of corona emission from 1016 Hz to 150 keV. (b) Observed SEDs (red data points) with the model best fits (lines) for SBS 0846+513, PKS 1502+036, and PKS 2004−447. The styles of the lines are the same as (a). (c) Observed SEDs (red data points and bow ties) with the model best fits (lines) for PMN J0948+0022 observed in nine campaigns. The styles of the lines are the same as (a). The SEDs observed in the MJD 54986 and MJD 54936 campaigns are consistent with the SEDs obtained in the MJD 54976 and MJD 54996 campaigns within the error bars. Their data are also shown with gray triangles, but they are not included in our SED fits.
Other Images in This Article


Copyright and Terms & Conditions
© 2015. The American Astronomical Society. All rights reserved.