Image Details
Caption: Figure 2.
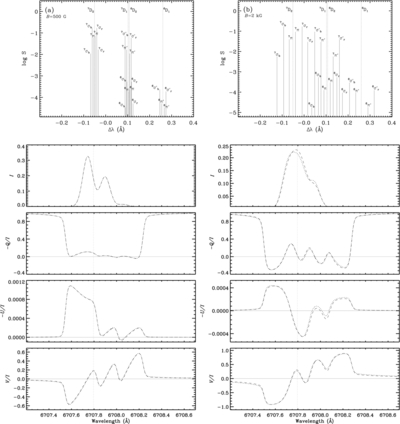
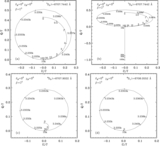
Top panels refer to the line splitting diagrams (line strength  vs. wavelength shift). The other panels show the comparison of the Stokes profiles computed using the PB-FS code (dashed lines) with the Zeeman-FS code (dotted lines). The two columns correspond to different field strengths, as indicated in the line splitting diagrams. The vertical dotted lines in the line splitting diagrams indicate the positions of the 7Li and 6Li D lines. The vertical dotted lines in the other panels correspond to the line center wavelength of the L = 0 → 1 → 0 transition in the reference isotope 7Li. The orientation of the magnetic field is given by (θB, ϕB) = (90°, 45°).
Other Images in This Article

Copyright and Terms & Conditions
© 2014. The American Astronomical Society. All rights reserved.